An aquarium water test log is a dated record of your test results with a short note of what you did to the tank that week, and it is worth keeping because a single reading tells you almost nothing while a trend tells you almost everything. Write down the date, the parameters you tested, and any event: a water change, a filter clean, a new fish, a skipped feeding. Six weeks of that is usually enough to show you whether your tank is stable, drifting, or heading somewhere you would rather catch early. The aquarium water parameters guide covers what each number means; this page covers what the sequence of numbers means.
Why a Log Beats Memory
I want to be honest about the thing that makes logging feel pointless: for the first few weeks, the log looks boring. You write down numbers, nothing happens, and it feels like homework.
The value arrives later, and it arrives in two forms.
The first is diagnosis. When something goes wrong, the first question anyone competent will ask you is "what changed?" Without a record, the honest answer is "I do not know." With a record, you can look back and see that you replaced the filter cartridge eleven days ago, or that nitrate has been climbing for a month, or that the last time the tank looked like this you had just added three fish. A log turns a mystery into a timeline.
The second is confidence. A tank that reads the same way week after week is a tank you can stop worrying about, and that is worth something in a hobby where beginners tend to fiddle. Most of the harm I see beginners do to their tanks comes from reacting to a single reading. A log is the cheapest protection against overreacting.
What Goes in an Aquarium Water Test Log
Almost every logging guide and logging app covers the same ground here: record date, ammonia, nitrite, nitrate, pH, and hardness if you test it, plus temperature, which costs nothing to read.
That list is fine, and it is also the part that everyone gets right. The part people leave out is the column that makes the log diagnostic rather than decorative.
| Column | Why it earns its space |
|---|---|
| Date and time of day | pH in particular moves across a lit day, so readings taken at wildly different hours are not comparable |
| Ammonia and nitrite | The two that should read zero in a finished tank, and the two that explain most sudden trouble |
| Nitrate | The one you manage rather than eliminate, and the one whose slope carries the information |
| pH (and KH if you test it) | Read together they show drift, which is invisible in a single reading |
| Temperature | Free, and it explains fish behavior more often than beginners expect |
| What I did to the tank | Water change and roughly how much, filter maintenance, new livestock, new plants, feeding changes, anything dosed |
| What I saw | Cloudiness, algae, a fish behaving oddly, a fish missing, plants melting |
Those last two rows are the ones I would fight for. Numbers alone tell you the tank changed. Numbers next to events tell you why.
Paper, Spreadsheet or App
At the time of writing there is a small market of aquarium logging apps (AquaticLog and Aquarium Tracker are two that have been around a while), plenty of printable log sheets, and a long tradition of hobbyists just keeping a spreadsheet. Forum threads on Fishlore and Reef2Reef about parameter-tracking spreadsheets go back well over a decade.
None of them is better than the others in any way that matters. The one that works is the one you will still be using in two months.
- Paper by the tank wins on friction. If the notebook is next to the test kit, the entry gets made.
- A spreadsheet wins the moment you want to see a trend, because it will draw the line for you.
- An app wins on reminders and on having the record in your pocket at the fish store.
If you are undecided, start on paper and move to a spreadsheet when you have enough entries that you want to see the shape.
What Six Weeks of Readings Will Show You
Six weeks is roughly the point at which a log stops being a list and starts being a picture. Here is what the common shapes mean.
The shape of a cycle
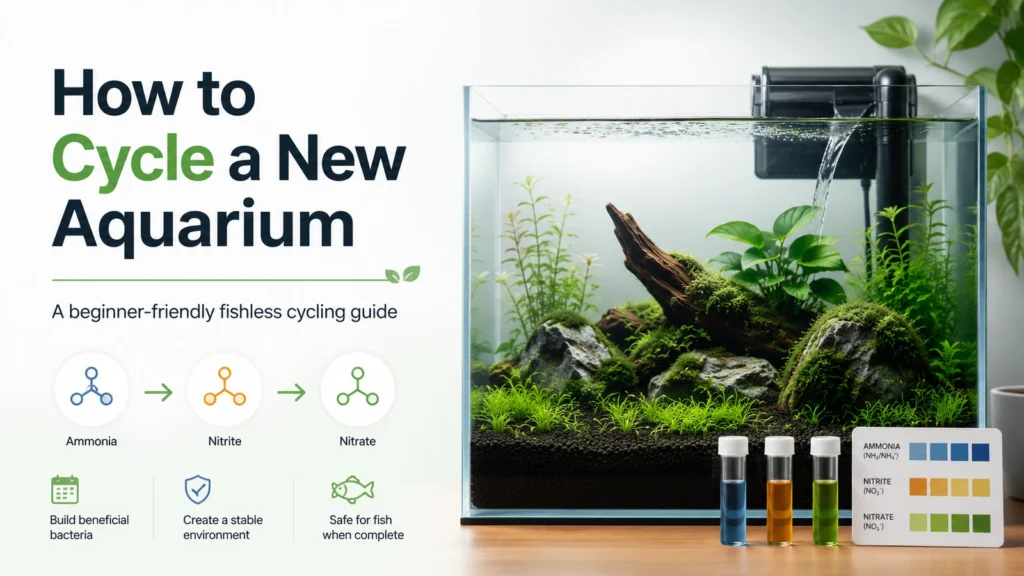
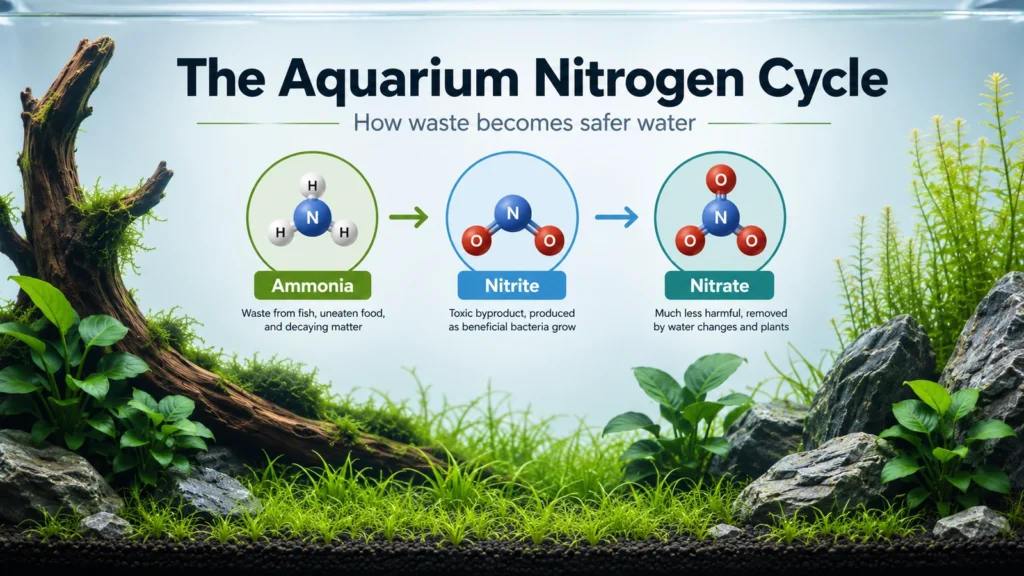
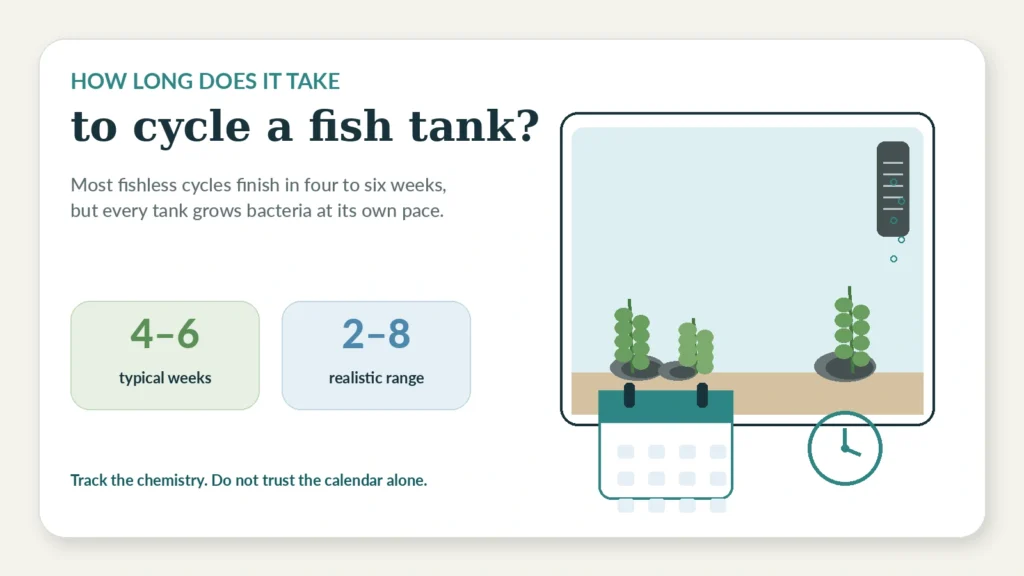
If the tank is new, the log will draw the nitrogen cycle for you: ammonia rising then falling, nitrite rising after it and then falling, nitrate appearing last and staying. That sequence is the single clearest evidence that the tank is doing what it should, and it is far more convincing than any one test result. If your log shows ammonia stuck with no nitrite ever appearing, that is a stall, not a slow cycle, and how to cycle a new aquarium covers what to check.
Nitrate: the slope is the story
In an established tank, nitrate is the parameter your log makes most useful. A number on its own means little. A slope means a lot.
- Rising steadily between water changes, back down after each one: normal. That is the system working, and the slope tells you how much time you actually have between changes.
- Rising steadily and not coming all the way back down: your water changes are smaller or less frequent than the tank's waste production. Either the changes go up or the input (feeding, stocking) comes down.
- Suddenly steeper than usual: something changed. Look at your events column for a new fish, heavier feeding, a dead snail you did not find, or a plant that melted.
- Flat at zero forever in a stocked tank: treat that as a question rather than a triumph. A nitrate reading of zero is sometimes good news and sometimes a kit problem.
pH drift
A single pH reading tells you where you are. A column of them tells you whether you are moving. Slow downward drift over weeks, especially in a tank with soft water and infrequent water changes, is the pattern worth catching, because it is buffering capacity being used up rather than pH misbehaving. Reading pH for beginners alongside your own KH column is the sensible follow-up. What matters here is that drift is only visible in a log. Nobody notices it in a single test.
The flat line
Weeks of identical readings in a stocked, fed tank are usually good news and occasionally a warning about the kit. Reagents age, and an old bottle produces plausible wrong answers rather than obvious ones. If everything has read exactly the same for a long stretch, cross-check once against a different kit or a store test. Why two test kits disagree covers what to do when they do.
The blip after something you did
This is where the events column pays for itself. A small ammonia reading three days after a filter clean, a nitrate jump the week after new fish, cloudiness the day after a substrate disturbance: each of these is unremarkable when you can see the cause sitting next to it, and each of them is alarming when you cannot.
The Honest Limits of a Log
A log does not stabilize anything. It records. If the tank is overstocked, writing the numbers down changes nothing about the overstocking.
It is also only as good as your testing habit, and a punishing schedule produces no data because it gets abandoned. How often to test your water covers realistic frequencies for new and established tanks; the log should follow that schedule, not invent a stricter one.
And a log cannot tell you a number is right. It can only tell you a number is different. That is still most of the value, but it is not all of it.
FAQ
How long before a water test log is actually useful?
Roughly six weeks, or one full cycle in a new tank. Before that you have data points; after that you have trends. The log becomes most useful retrospectively, on the day something goes wrong.
What should I write down besides the test results?
Water changes and roughly how much, filter maintenance, new fish or plants, feeding changes, anything you added to the water, and anything you noticed (cloudiness, algae, odd behavior). This is the column that turns a list of numbers into an explanation.
Do I need an app, or is paper fine?
Paper is fine. Apps and spreadsheets make trends easier to see and add reminders, but the format that survives two months beats the format with the best features.
Should I log temperature if I have a heater?
Yes, and read a thermometer rather than the heater dial. Temperature costs nothing to record and it explains a surprising share of fish behavior questions.
Does logging replace testing more often?
No. It makes a reasonable testing schedule more valuable. Testing on a sensible rhythm and writing it down beats testing constantly and remembering none of it.